
If you’ve ever wandered through Manhattan and felt like you were dodging more dogs than people, you’re not imagining things. After diving deep into NYC’s dog licensing data, I found something pretty wild: In 14 ZIP codes — all packed into Manhattan — more than half of households have registered a dog over the past decade. 🐶
Curious to see how far the city’s love for dogs stretches, I cleaned up the data in R, matched it with household counts, and built a few charts with Datawrapper.
Let’s take a look:
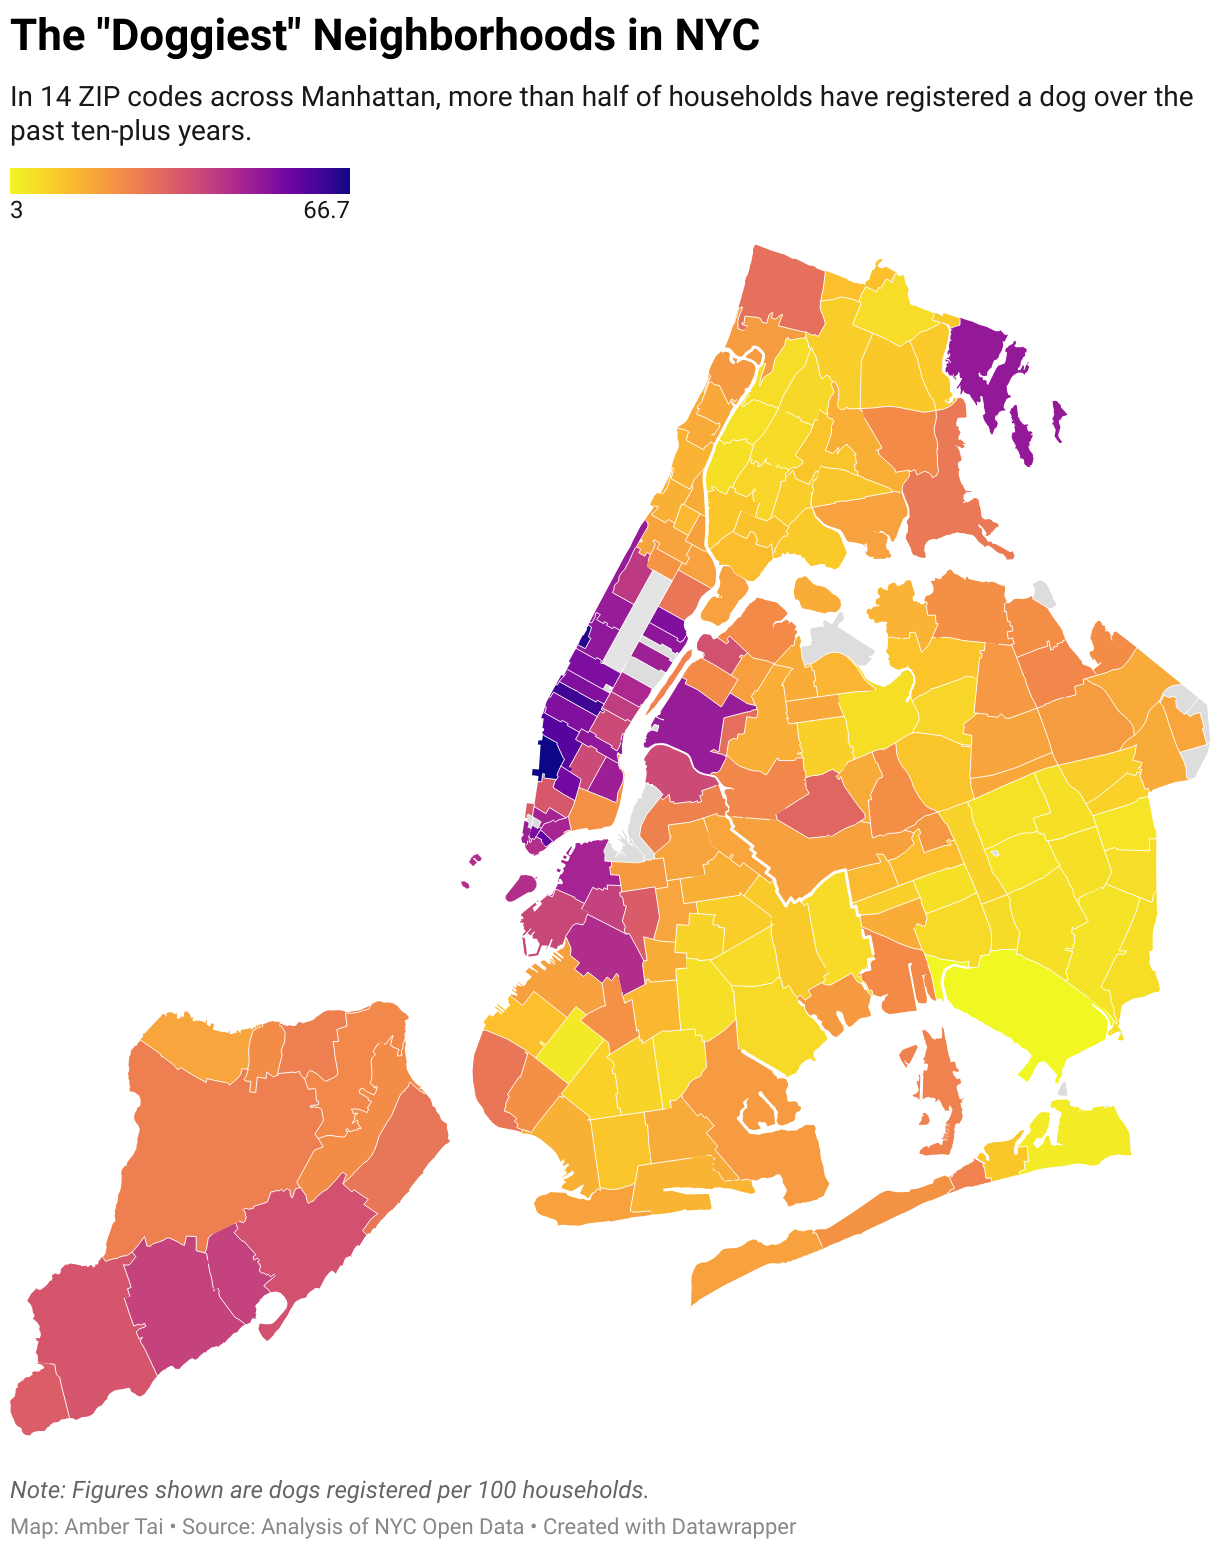
Here’s the map: it shows the number of registered dogs per 100 households across New York City. And Manhattan lights up.
Fourteen ZIP codes in Manhattan have dog registration rates above 50%. That’s insane when you think about it: in some neighborhoods, having a dog isn’t just common, it’s practically expected. 🐕
While Staten Island and Brooklyn have decent pup populations too, nowhere matches the density of dog households like Manhattan.
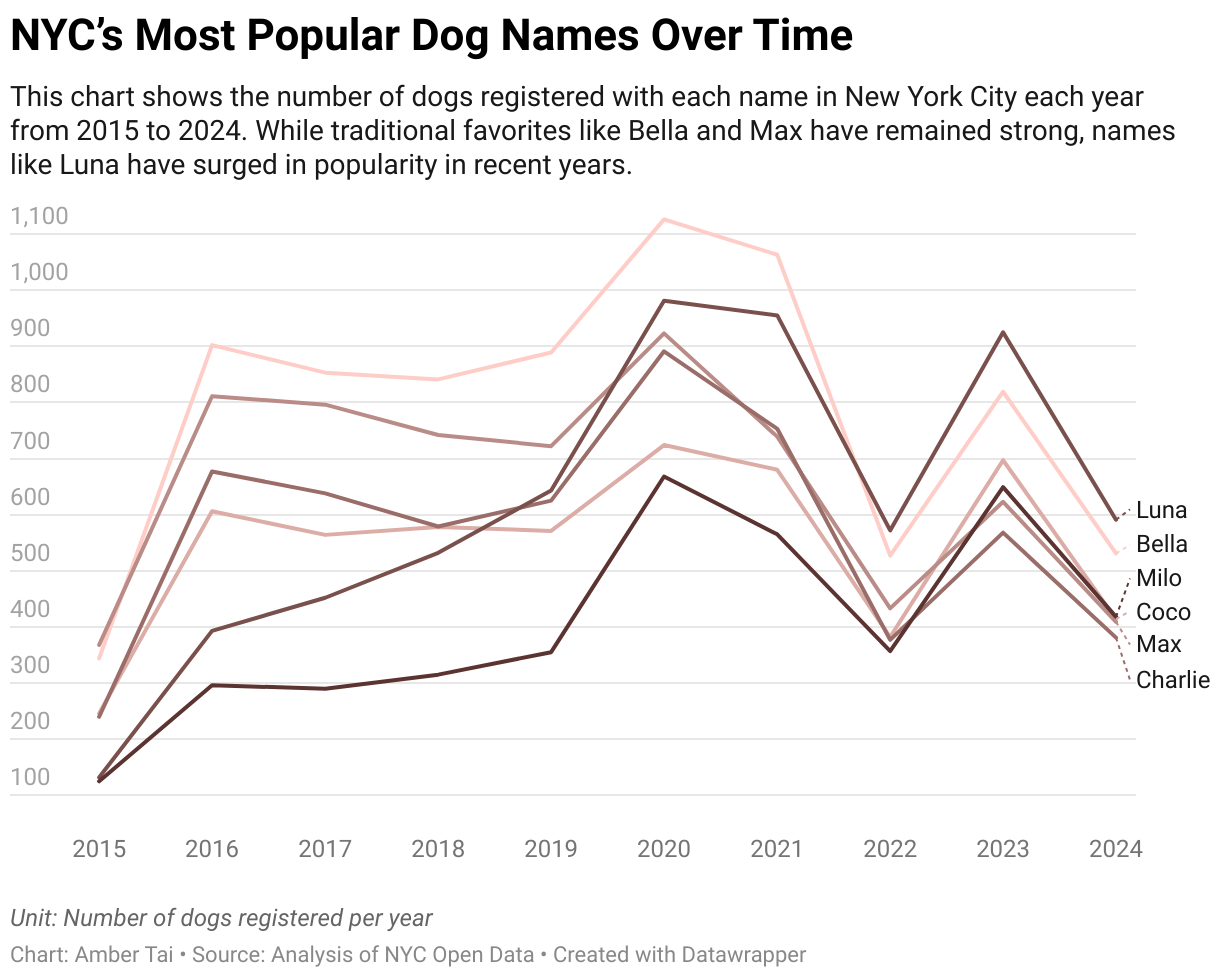
NYC’s Most Popular Dog Names Over Time
Here’s something fun: Bella and Max have been holding it down for years as the city’s most popular dog names. But keep an eye on Luna — she’s the rising star. Over the past few years, Luna has shot up in popularity, nudging out some of the old favorites.
Tiny Dogs Rule the City
If you guessed that NYC favors small dogs, you’d be absolutely right.
The top three most-registered breeds—Yorkshire Terriers, Shih Tzus, and Chihuahuas—are all small pups, usually under 15 pounds. No surprise there: in a city of walk-ups, tiny apartments, and crowded sidewalks, being compact is basically a survival skill.

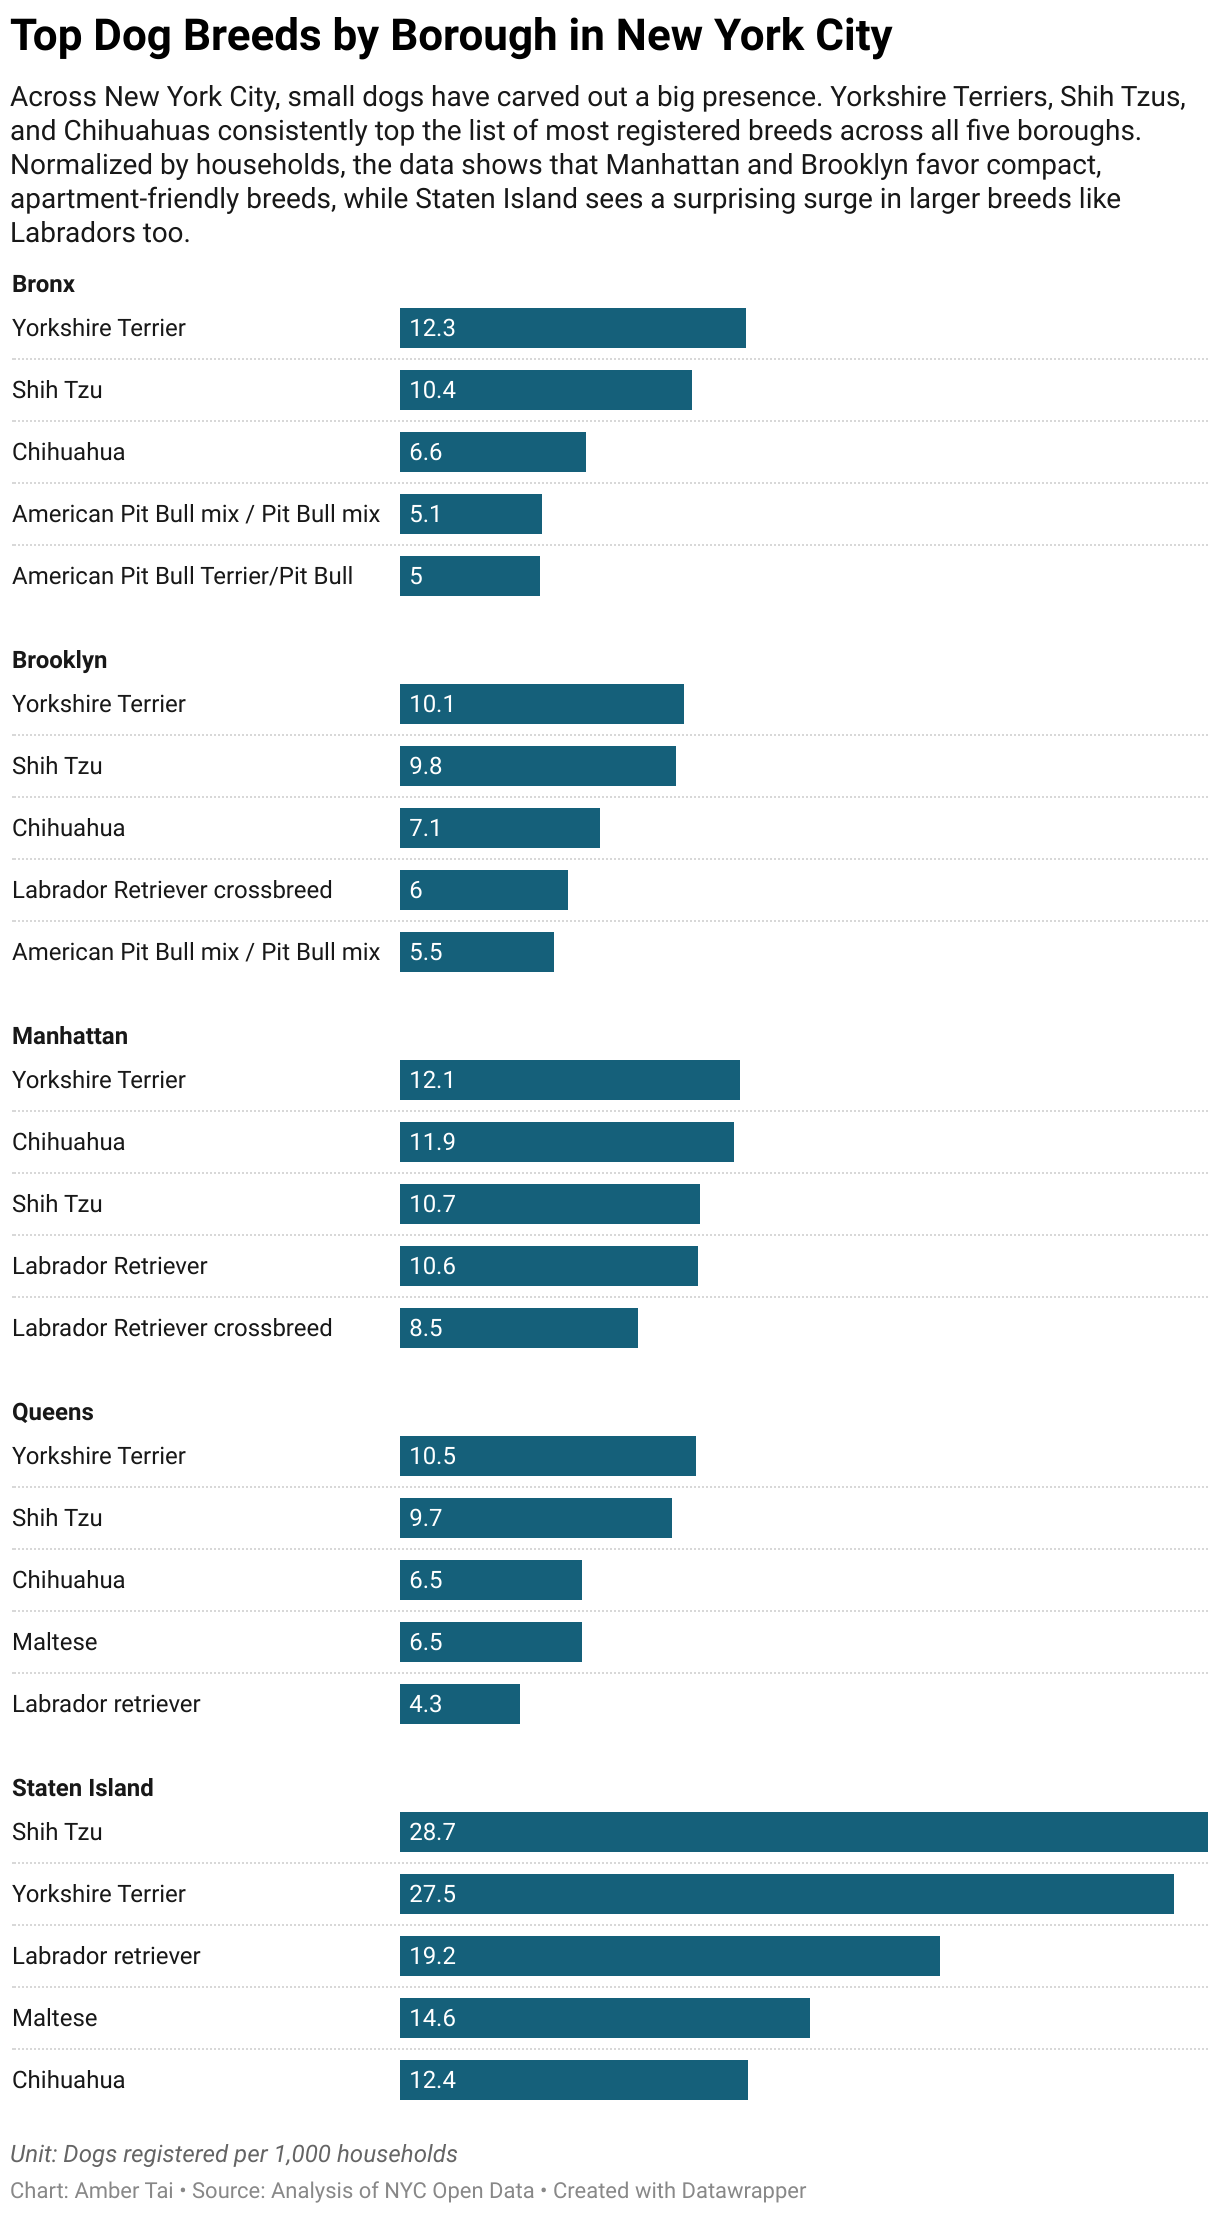
Each Borough Has Its Own Dog Personality
When I normalized the numbers by household size, some fun patterns popped up (based on dogs per 1,000 households) :
- Manhattan and Brooklyn love small, apartment-sized breeds like Yorkies and Shih Tzus.
- Queens sticks with smaller dogs too but has a soft spot for Maltese.
- And then there’s Staten Island, which goes its own way — not only does it have lots of small dogs, but bigger breeds like Labradors show up strong too.
How I Pulled It Together
- Data Source: NYC Open Data Dog Licensing Dataset.
- Cleaning: I filtered out non-dog records (and a surprising number of “Unknown” entries) with R, standardized the breed and name spellings, and made sure only real, complete registrations stayed in.
- Joining Data: I connected dog records to borough and ZIP code household stats. (Household counts were sourced from the U.S. Census Bureau’s American Community Survey 2022 5-Year Estimates.)
- Normalization: To compare fairly across boroughs, I calculated the number of dogs per 100 or 1,000 households.
- Visualization: Built interactive maps and charts using Datawrapper.
(And yes — I did more than a few double-takes when the number crunching showed just how many Yorkies live here.)
Wrapping it up. From pint-sized pups in penthouses to bigger dogs in suburban Staten Island backyards, the data makes it crystal clear: dogs are everywhere in NYC, but their size and breed tend to match their borough.


Leave a comment